 Creating fun and sharable content for your store’s online blog is a great way to boost traffic, increase links and market your products to wider audiences. One fantastic form of content for achieving this is infographics.
In this article we intend to:
● Explain exactly what an infographic is
● Tell you why infographics are so useful
● Give you ideas about what to include in an infographic
● Show you exactly how you can make one
● Give you tips on how to get the most out of your infographics
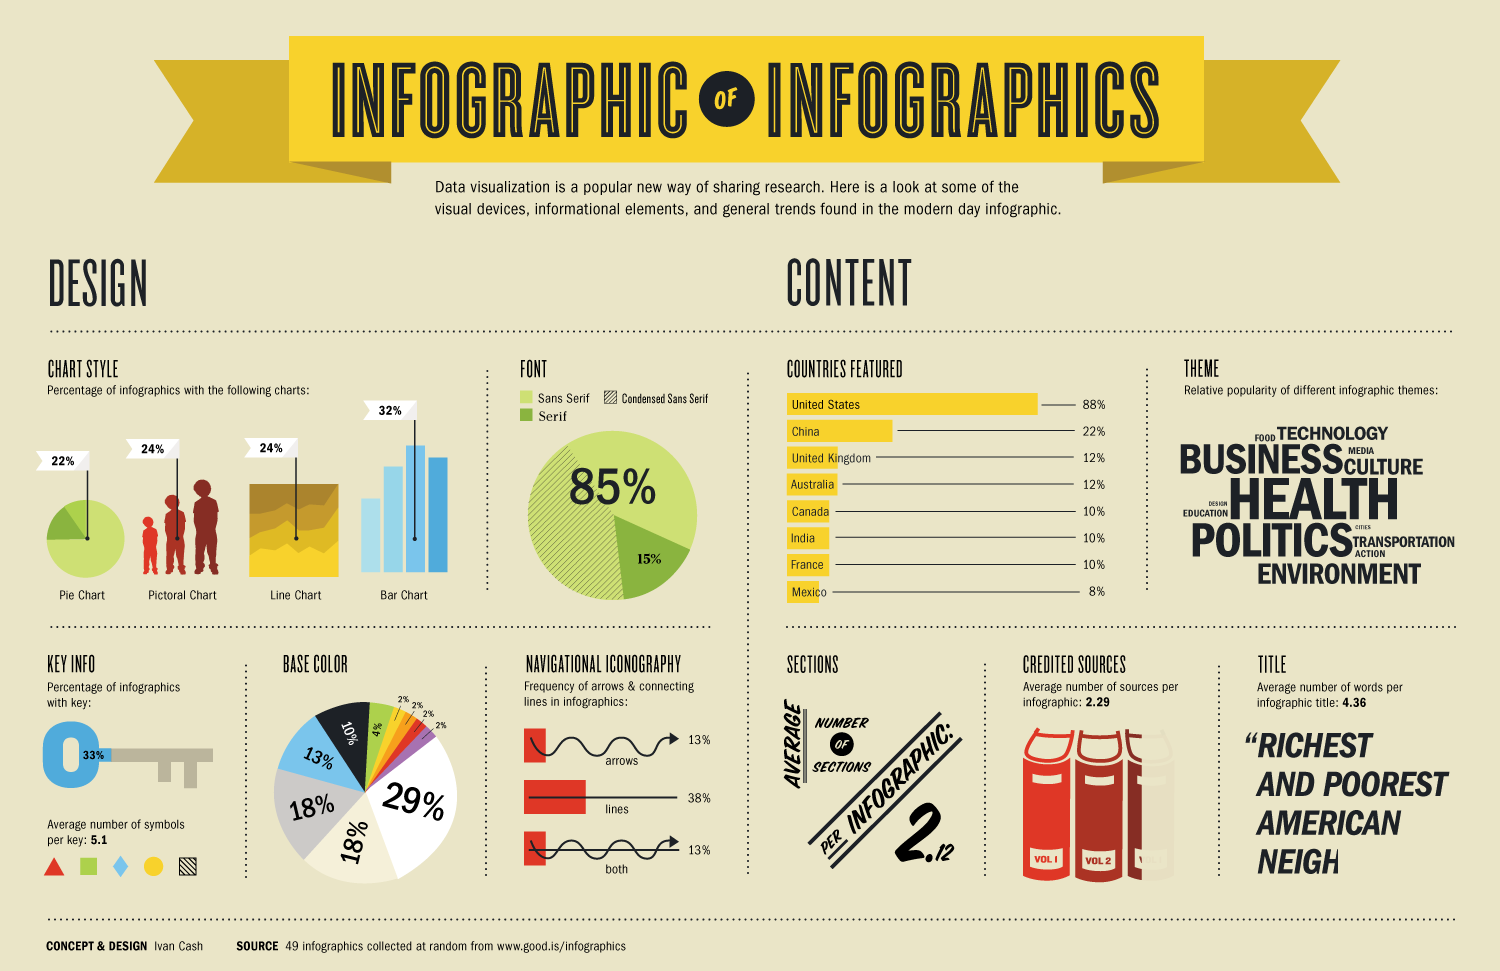
What is an infographic?
Infographics are graphic, visual representations of information, data or knowledge. They can be used to present complex information quickly and clearly given that the average human understands information better when it is represented visually. They can contain lots of numbers, words and usually some form of imagery and lots of colour.
They are used to help people to visualise and understand data, a new concept, findings from a study or to demonstrate a product or service.
Why are they useful?
As an online retailer there are no doubt many different ways you market your site and attract traffic. Infographics are a fantastic tool for doing this for a number of reasons:
They are very sharable and can go viral – social media loves infographics. When you are trying to convey a message to your customers and their networks on social platforms you need to do so in a fun way otherwise your message could go ignored. If you can create a nicely designed, engaging infographic they your followers will share it with their friends and it will spread across the web taking your brand and a link back to your site with it.
They are good for SEO – if you tag your infographic well it can give your SEO a boost. Linking to an infographic is quite common for bloggers and other internet users so it will give you extra links. It will also be judged as high-quality content by Google giving you a boost in its rankings.
They can be used to position you as a thought leader – Sharing data and information with your audience using infographics really positions you as an expert in your field which fosters trust and makes you stand out against competition.
What kind of information should you put into your infographic?
Whatever information you place in your infographic it should be relevant to your store. You could create an infographic using statistics about the market you are in – say if you sell bicycles for example – what is the bike market like at the moment? Have they increased in popularity? What is the best selling model? Etc. You can use statistics from other sources as long as you give them a reference in your infographic.
Or you could create your own relevant stats. You could do this by creating a survey and sending it to your mailing lists or simply by delving into your own analytics. What is your most popular bike? What day of the week do most people buy bikes? And so on.
If you are launching a new product you could use an infographic to inform your customers about it.
How to create an infographic:
Once you have got your list of statistics and nuggets of information that you want to display in your inforgraphic it is time to make it. If you feel completely out of your depth creatively you can always commission a graphic designer to put one together for you. But there are plenty of tools available out there for you to have a go at making it yourself.
Here is a list:
Piktochart
This is free and relatively easy to use – designed for non-designers. You simply create an account and you can start making your infographic using one of the free themes (there are paid-for ones too if you like).
Easel.ly
Very similar to Piktochart, this also uses free themes with drag and drop functions to let you easily create your content.
Infogr.am
Again this free tool has a user-friendly interface and allows you to create your infographic. It allows you to create charts using real data with 31 chart options so good if you have a lot of dense chart-type data.
How to get the most out of your infographic
If you are going to get the SEO benefit out of your infographic you need to make sure you include plenty of keywords. Think about what headline you use and headings in the infographic. Categorise it with tags and use keywords in the file name and in the alt text of the infographic if saved as an image.
When it comes to publishing it – it is best to embed the infographic onto a page on your site – most likely your blog. This makes sure that when you share it, it links back to your website.
Some online tools, Piktochart for example, allow you to have an interactive layer embedded in the graphic. This allows you to enter indexable content such as keywords and a description making it easy to crawl for search engines.


Speak Your Mind